I like how tailwind provides scoping automatically. But in projects already having a build system I use css modules. Writing pure CSS is so much nicer but please don't make me manage class names myself.
I moved to Zed last week and its been amazing so far! Something about using it feels a lot more crisp and fast compared to vscode. Their AI integration is pretty decent too. But I am very glad I can disable AI now. I find AI sometimes takes me out of the flow because I am constantly reviewing its code.
Did some quick tests and Claude 3 Sonnet responses have been mostly wrong compared to Gemini :/ (was asking it to describe certain GitHub projects and Claude was making stuff up)
You can easily see N+1 queries on the console itself or write a callback function to track such issues on your monitoring stack of choice on production.
I did this by adding every SQL query to a new log file (only active in development), then tailing it while developing. Not only is 1+N very visible as a long string of the same query over and over, it also lets you see in real time when there's a long pause from a query taking longer than expected.
Also we often had something that was more like 1+3N, basically a 1+N problem but it was looping through the same 3 queries over and over.
Yeah the query count monitoring is the main focus as N+1 queries are super common in Django.
I don't really have a pitch but here is why this was made:
1. we had a production DRF app with ~1000 endpoints but the react app consuming it was dead slow because the api's had slowed down massively.
2. we knew N+1 was a big problem but the codebase was large and we didn't even know where to start.
3. we enabled this middleware on production and added a small callback function to write endpoint=>query_count, endpoint=>query_time metrics to datadog.
4. once this was done it was quite trivial to find the hot endpoints sorted by num of queries and total time spent on queries.
5. pick the most hot endpoint with large number of queries, enable debug mode locally, fix N+1 code, add assertNumQueries assertions to integration tests to make sure this doesn't happen again and push to prod.
6. monitor production metrics dashboard just to double check.
7. rinse and repeat.
For me this ability to continuously run on prod -> find issues and send to your monitoring stack -> alert -> fix locally workflow is the main selling point. Or of course you can just have it running locally on debug mode and check your console before pushing your changes but sometimes its just hard to expect that from every single engineer at your company. Then again your local data might not cause an issue so production N+1 monitoring is always nice.
It only adds like ~5ms. Unless you have `query_level_metrics_enabled` as True which takes more time. I didn't find that particularly useful on prod and instead just used it locally when fixing stuff. Depends on what data you need populated in your callback function on prod.
The header feature can also be useful. If you have a client on-call who's complaining about super slow page loads. Just check their network tab and see which response has a query count/time header which seems unnatural.
I usually add it to existing integration tests so that they raise exceptions on N+1. If test coverage is low then I would suggest sending the N+1 metrics to something like datadog. That way your users using the product will reveal all the N+1 issues on your monitoring solution.
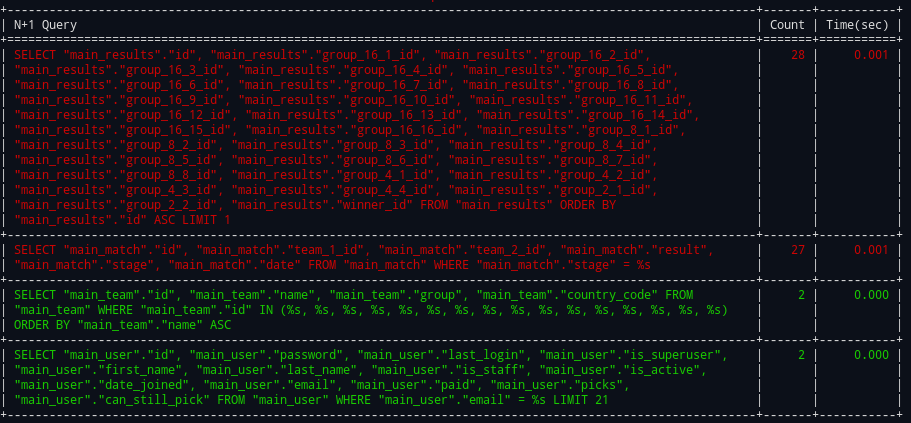
EDIT: I should add a screenshot to the README lol but the middleware will print each api being called with a nice table showing each query and the number of times it was called for the api.